Water content plays an important role in the behavior of clayey soil.
When the water content changes, clay surprisingly changes its characteristics. When subjected to a large amount of water, it is similar to a lean soup, which we call the liquid phase. At a little drier state, it becomes similar to soft butter, called the plastic phase. At a further dried stage, it behaves like a cheese or semi-solid, and at a very dry stage, it is like a hard candy, a solid phase.
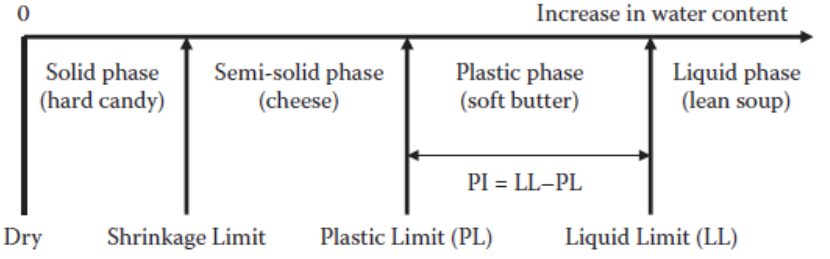
The Liquid limit,LL, is defined as the water content between the liquid phase and the plastic phase.
The Plastic limit, PL, is defined as the boundary water content between plastic and semisolid phases.
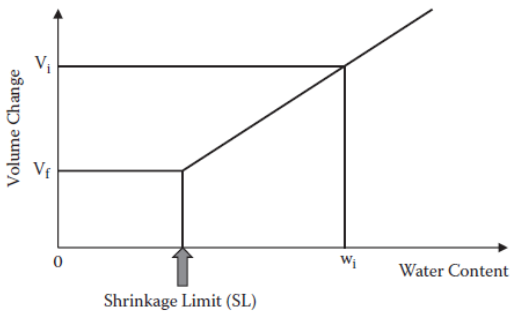
Shrinkage limit, SL, is defined as the maximum water content below which no further volume change of the clay will occur.
These situations are demonstrated in the above figure.
At the shrinkage limit, the soil is still fully saturated.
LL and SL can be understood from the learning of the clay–water system. The adsorbed water layer is considered an integral part of clay particles.
After encountering water, due to the action of the electrostatic field force, the positive ions and polar water molecules in the water will be adsorbed around the particles and aligned to form a water film. This part of water is called adsorbed water.
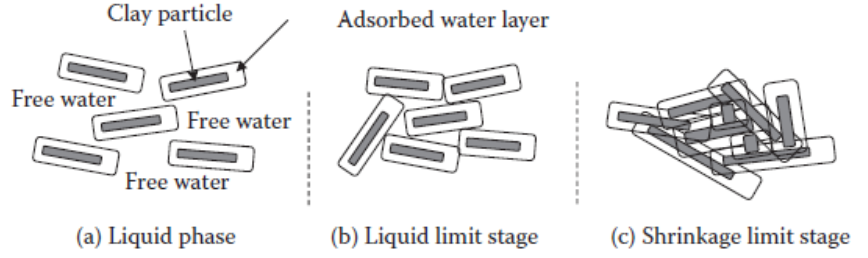
As shown in Figure above, when clay particles contain enough water, adsorbed water layers are not at all in contact with each other. Therefore, there is no frictional resistance. It is at a liquid stage as shown in above Figure a.
Now, when water is taken away to a certain level at which all the adsorbed water layers are just in contact, frictional resistance will be built up at the points of contact. This is considered to be the stage of LL as shown in Figure b. When it is further dried, overlapping of the adsorbed water layer will take place.
The limiting stage of this overlapping is the level at which all particles themselves touch each other and no further overlapping will be possible, as shown in Figure c. This stage is regarded as the SL.
PL may have some degree of overlapping of adsorbed water layers.
Those three limits are called the Atterberg limits. It is named after a Swedish scientist, A. Atterberg, who defined those limits in the early 1900s.
The present standard liquid limit test (ASTM D-4318) uses a small semispherical cup as shown in the figure below.
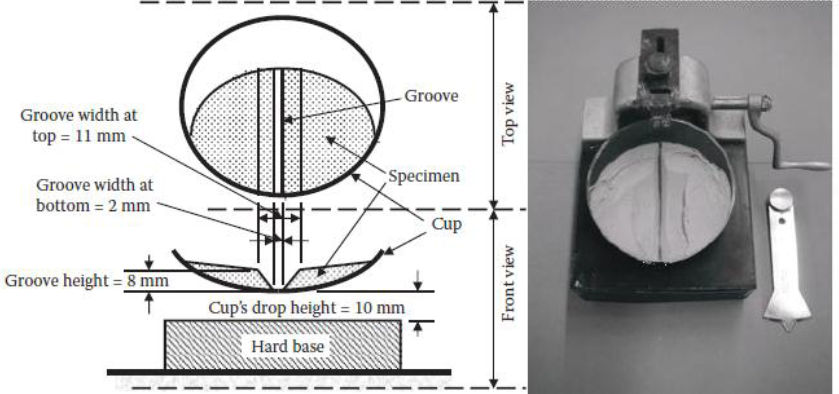
A thoroughly mixed wet clay specimen is filled into a portion of the cup, and a groove is cut with a special grooving tool on the center portion of the specimen. The cranking handle is fitted to a cam that lifts and drops the cup when rotated. The handle is then rotated at the speed of two revolutions per second until the opening of the groove in the clay sample closes with a 13 mm length.
The number of revolutions or blow counts is documented. The water content at this stage is calculated.
Several trials are conducted with different specimens, with slightly different water contents. Usually, these water contents differ only by a few percentages.
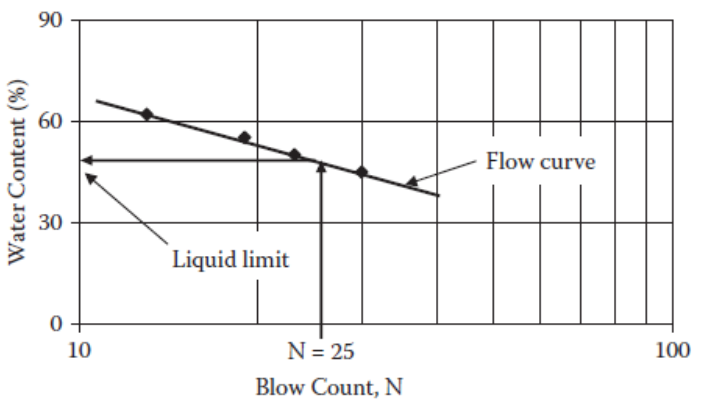
A Flow curve, which plots the blow counts and the corresponding measured water contents in a semi-log scale, is prepared, as shown in the Figure.
LL is then termed as the water content with 25 blows in the flow curve.
PL test is run in a more basic way (ASTM D-4318).
A drier specimen is rolled into a thread by human palms on a glass plate. PL is defined as the water content at which a rolled thread just crumbles with a 3 mm diameter, as shown in the figure below.
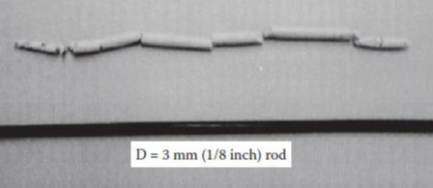
Several trials shall be made to take the average water content at that stage to get the PL value.
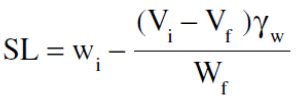
The SL test is done by measuring the water content wi and the volume Vi of a saturated specimen, slightly above its LL, and the oven-dried volume Vf and weight Wf of the same specimen.
Since the volume change due to shrinkage from Vi to Vf is simply due to loss of water from wi to SL, weight loss of specimen (Vi − Vf) x γw is equal to (wi − SL) x (100) x Wf , and thus:
From these limits, various important parameters are developed.
The plasticity index (PI) is defined as PI = LL − PL
It indicates the range of water content of a material for its plastic behavior, and many engineering behaviors of clays are related to PI.
Another parameter called the liquidity index (LI) is defined as;
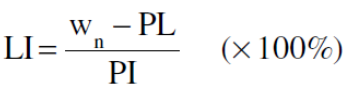
where wn is the natural water content of the soil.
The liquidity index shows the position of the current water content above the PL relative to PI. In most in situ soils, LI ranges from 0% (wn at PL) to 100% (wn at LL).
What Building Materials are we running short during unusual weather patterns and odd geology changes within Asia Basin ?
Many thanks for the Quick Revision Formula and Notes above.
Best wishes for Technicians working in Lower Ground tunnels and Mezzanine Levels.
Noted Construction Activity and replacement components going on below my First Floor Level Apartment in Colombo Narahenpita Manning Town Complex, Premises Plan – behind the Narahenpita railway road.
Many Happy Rewards for completing most of the dirty, dusty, dark work tasks in the past three weeks. Wish you all and Team Leaders a Healthy Environment with Better work conditions soon! Annual General Meeting to be held via Project Co-ordinates on Sunday, 27 April 2025 at 3:00pm within Premises. RSVP